Introduction to SQL Server Extended Events in SQL Server 2012
Recently in one of my SQL Server seminars, I was asked to give a short introduction and a demo on SQL Server Extented events.
In this post I will explain what Extended Events are and provide a hands on demo.
SQL Server Profiler is (was) the main tool for DBA admins and developers to find out why there were performance issues with SQL Server queries and troubleshoot them. DBAs also use sql traces, DBCC commands and trace flags for performance related issues. Now we have an additional tool in our disposal. We have SQL Server Extended events which were firstly introduced in SQL Server 2008.
SQL Server 2008 introduced Extended Events which is a system for collecting event-driven data about a SQL Server instance and its databases. In SQL Server 2008 we had no GUI (wizards) for the extended events, In that version of SQL Server 2008 we had to write complex T-SQL statements to gather the information we needed to analyse. The results from those SQL queries was returned in an XML format and sometimes it was difficult to analyse them. In SQL Server 2012 we have support for Extended events in SQL Server Management Studio through a GUI component which makes working with Extended Events a simple operation. You can find the Extended Events node under the Management folder in SSMS. We use sessions (we create and configure sessions) to collect data in order to analyse it. Extended events have less impact on the server resources than SQL Server Profiler.
Let's move on to our actual demo. I will use Extended Εvents sessions to capture and analyse data about deadlocks.
We have a deadlock when two separate processes/transactions hold locks on resources that each other needs. Nothing can happen. This situation could go on forever.But one of the transactions is forced by SQL Server to “die”.SQL Server selects a victim and kills the process/transaction. It usually kills the one that is least expensive to roll back. We can also have some control over the process to be chosen to be the victim by setting the deadlock priority by typing “SET DEADLOCK_PRIORITY LOW”.This option makes SQL Server to choose that session to be the victim when a deadlock occurs.
If you want to find our more about deadlocks then have a look at this post of mine.
In that post I use the SQL Server Profiler to look for Deadlock events (Deadlock Graph event).
I have installed in my Windows 8 machine an instance of SQL Server 2012 Enterprise edition. You can download a trial version here .
You can install the developer edition of SQL Sever 2012 as well.
I connect to my local default instance of SQL Server 2012 through windows authentication.
Then I navigate to Management->Extended Events->Sessions->New Session Wizard (right-click)
Have a look at the picture below.

Then we click Next. In the next screen we need to give a name to our session.
Have a look at the picture below

We give a name to our session and then we click Next. Do not choose the option "Start the event session at server startup".
In the next screen we do not use an existing template and then we click Next.

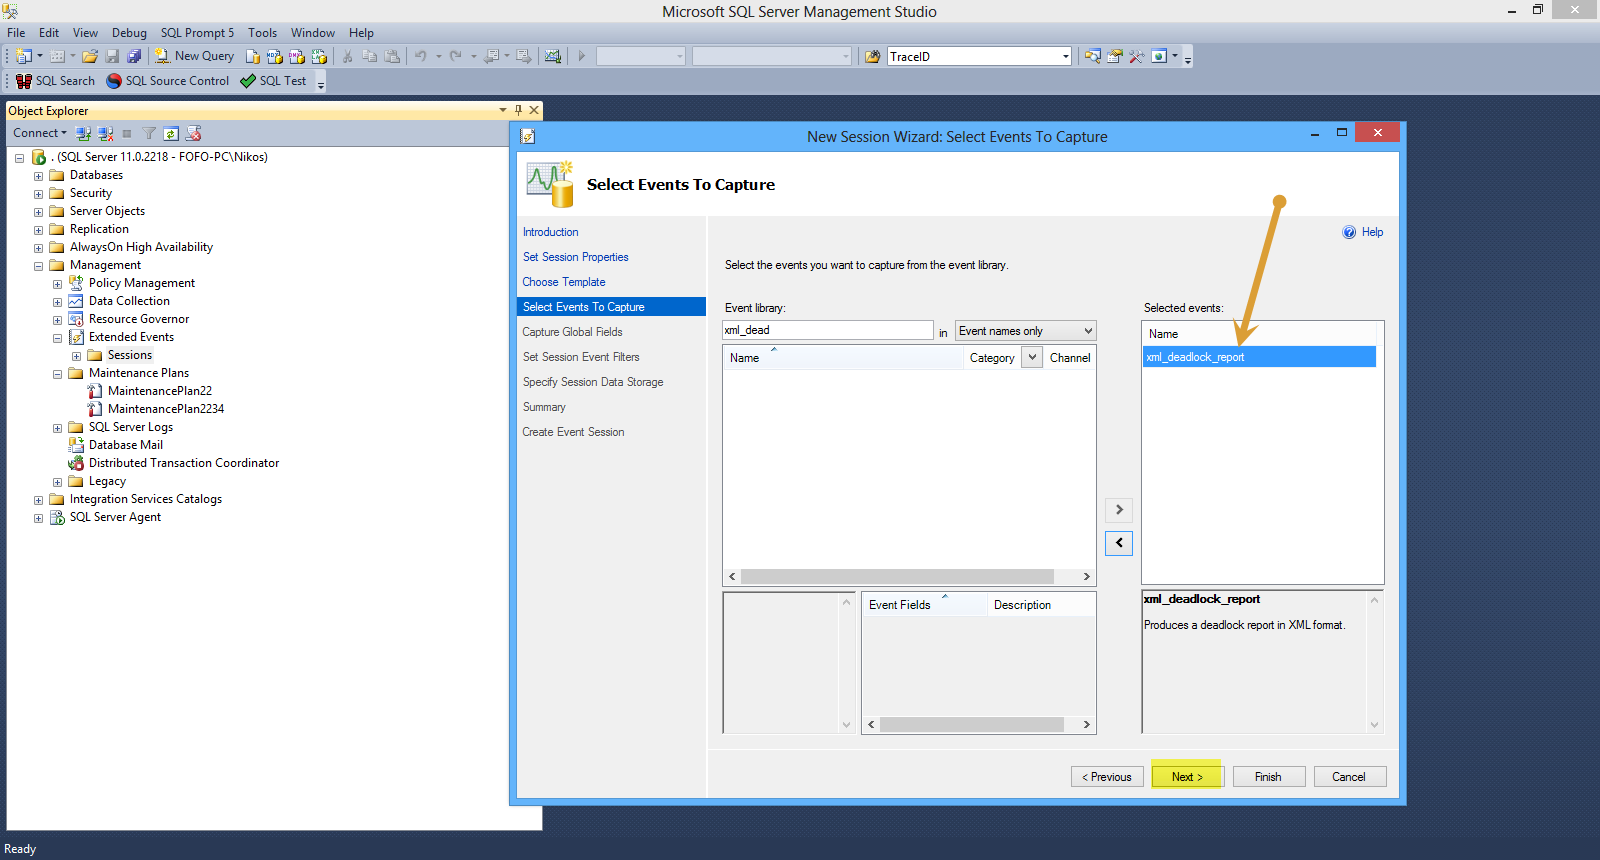
In this screen we can see all the events and select those that we want to capture from the event library.
I select the event xml_deadlock_report. We can have multiple events per sessions. Then I click Next.
Have a look at the picture below

In the new screen I can select global fields which are common to all events. In my case I select database_id and database_name and click Next.
Have a look at the picture below

In the next screen we can apply filters. I am not going to select any filters. Υοu can select any filters you want in another scenario. There are many clauses.
Have a look at the picture below

Then I click Next.
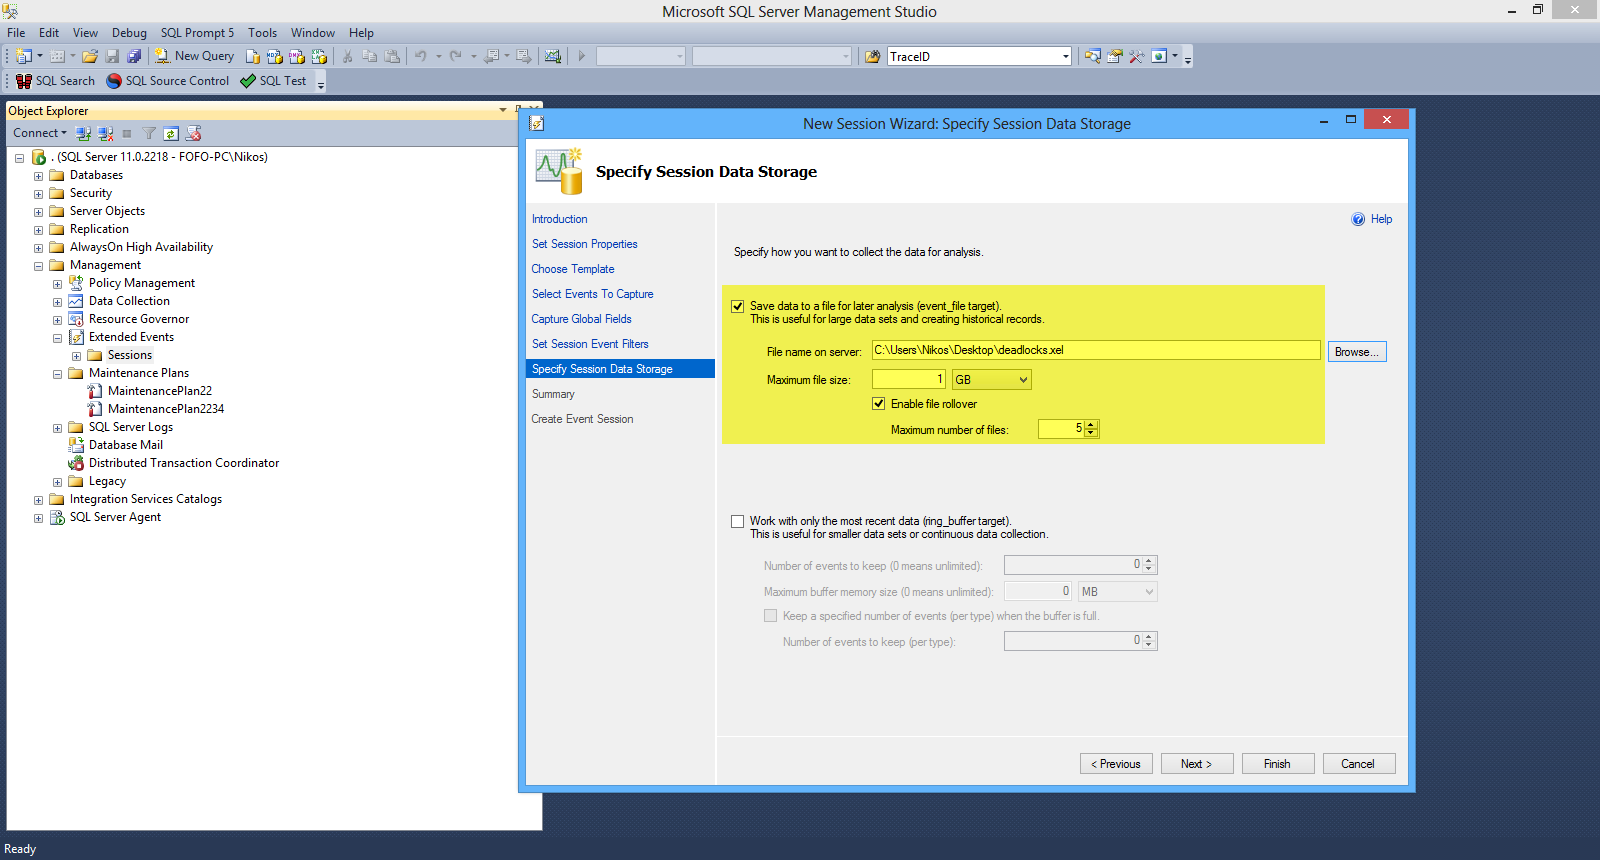
In the next screen I specify how we can collect the data for analysis.
I choose "Save data to a file for later analysis"
Have a look at the picture below

Then I click Next and I am presented with my summary list. We have the chance to review all the options and we can also script the whole process. Finally I click Finish and I am presented with the Success screen.
Finally we need to enable the session, so I click on my session (deadlocks) and choose "Start Session".
Now I am going to simulate a deadlock scenario. I have downloaded and installed the NorthWind database. You can download it from here.
In a new query window in SSMS , execute this first statement.
[sourcecode language="sql"]

USE Northwind
GO
--open a query window (1) and run these commands
begin tran
update products set CategoryID = 7

[/sourcecode]
In a new query window , execute this second statement.
[sourcecode language="sql"]

use Northwind
GO
--go to query window (2) and run this command

begin tran
UPDATE Suppliers set CompanyName = 'Mycompany'
update products set CategoryID = 12

[/sourcecode]
Go back to the first query window, and execute this third statement.
[sourcecode language="sql"]

-- go back to query window (1) and run this command

update Suppliers set CompanyName = 'TheCompany'

[/sourcecode]
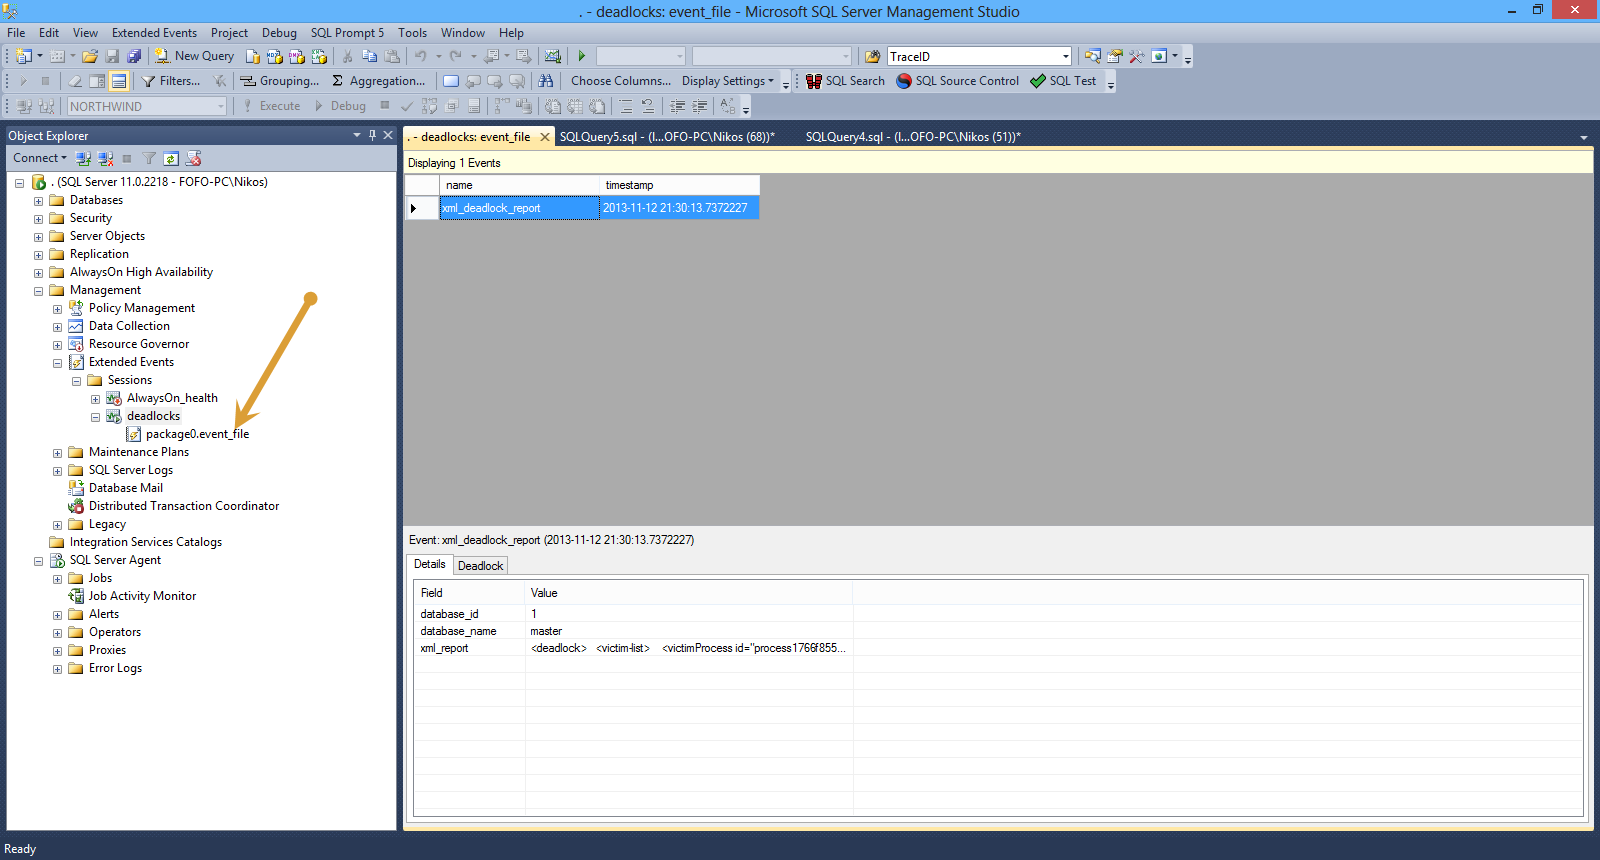
Now we have a deadlock. Double-click on the package0_event_file
We will see the captured information from the deadlock above.
Have a look at the picture below.

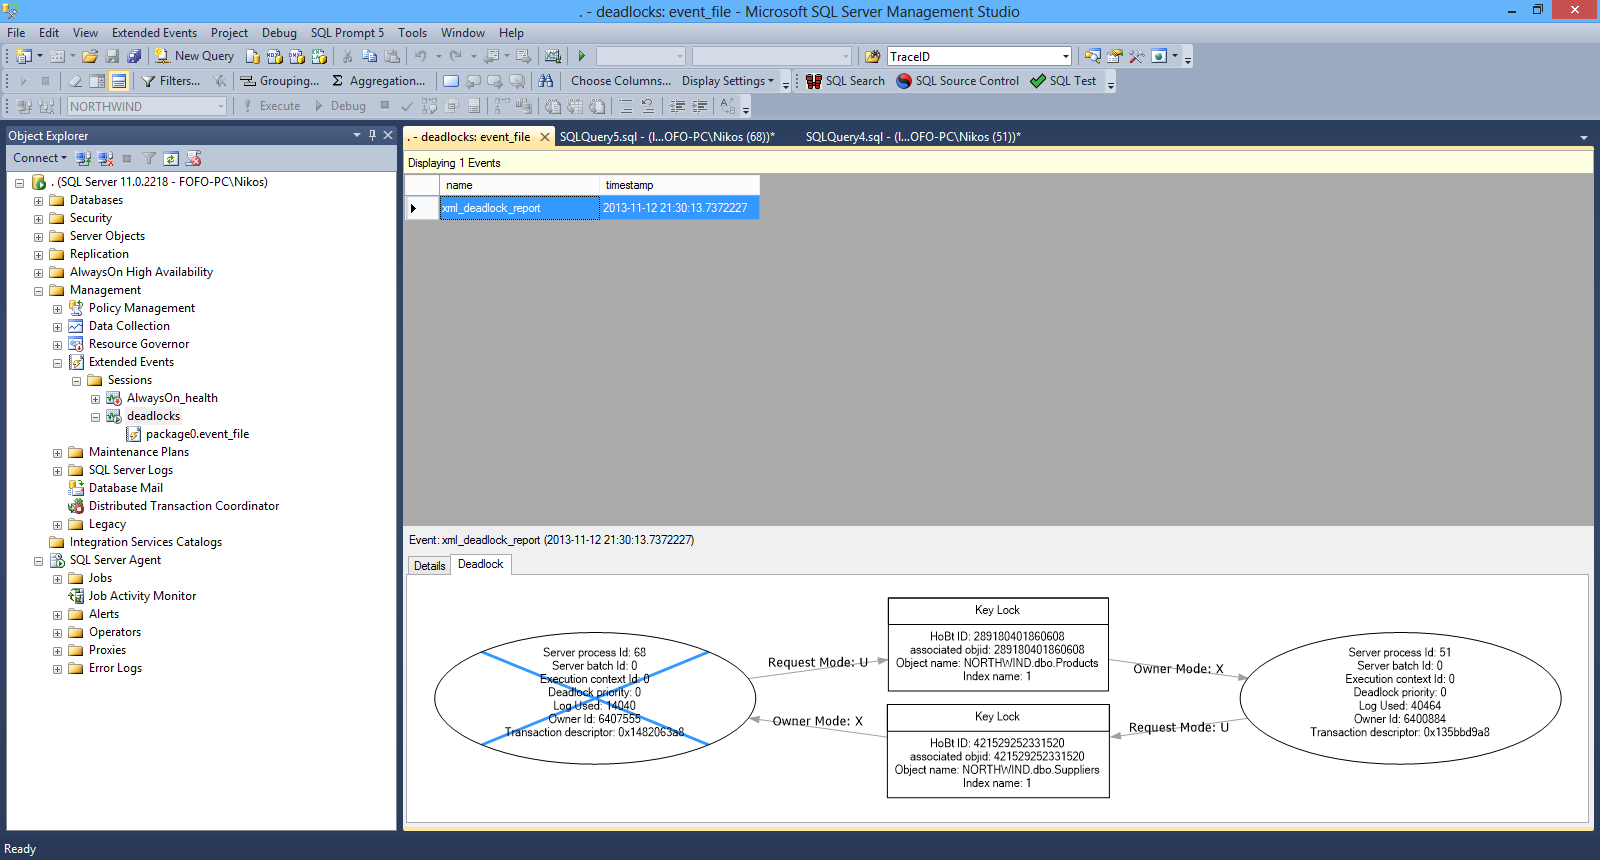
By clicking the "Deadlock" tab we can see a graph that gives us all the information about the processes.
Have a look at the picture below

I encourage you to use the SQL Server Extended events for gathering data for troubleshooting all aspects of an SQL Server 2012 instance.
Hope it helps!!!